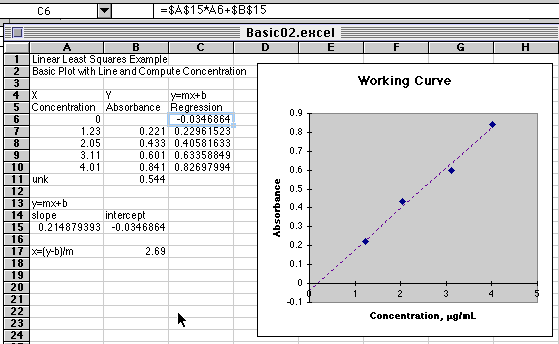
A Basic Working Curve Plot with Linear Least Squares Calculation of Concentration and Regression Line
©David L. Zellmer, Ph.D.
Department of Chemistry
California State University, Fresno
|
A Basic Working Curve Plot with Linear Least Squares Calculation of Concentration and Regression Line
©David L. Zellmer, Ph.D. |