|
Our first goal is to create a series of standard solutions that fits well within the best working range of our instrument. 
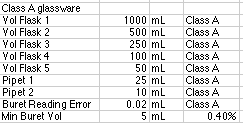
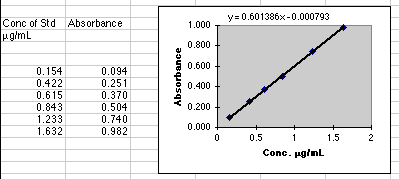  Constructing a Dilution Scheme This can be the most difficult part of a spectrophotometric analysis. The method chosen by most students is to wait until someone else figures it out, then copy what they do. Here is how you can figure it out for yourself. Rule 1: Give it your best shot, then try it out! What's the worst that can happen? You end up with solutions that are too light or too dark. If this happens, go back over your scheme and change something! It takes only a few minutes to make a new dilution, add the color forming reagents, and check out the result. It is unlikely you will have to do any time-consuming steps over again, such as redissolving a solid unknown. Rule 2: Know what you have to work with. Here is a list made from the locker contents of our analytical lab.
You may also be told which volumetric flask is to hold your final colored solutions. In this example we will use 50 mL volumetric flasks. Rule 3: Find some clues about suitable concentrations.
Rule 4: Adopt a scheme. If it doesn't work out, remember Rule 1.
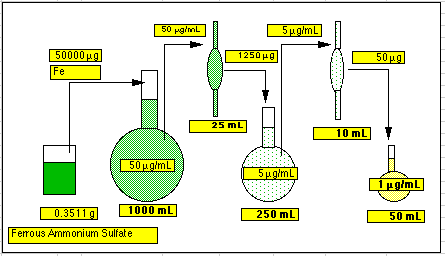
Ignore the numeric labels for now; we'll show you where they came from in a moment. What is planned here is to weigh out some suitable value (more than 0.1g) of ferrous ammonium sulfate (FAS), dissolve it in a big volumetric flask (including a bit of sulfuric acid to keep it from precipitating) to make a Stock Solution, then take an aliquot of this, then dilute it in another smaller volumetric flask to make an Intermediate Stock. Finally, we will take an aliquot of this intermediate stock, place it into our mandated 50 mL volumetric flask, add color forming reagents and water to the mark. This is the Final Flask. Rule 5: Work Backwards.
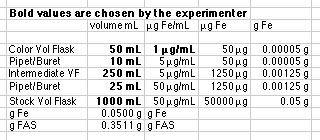
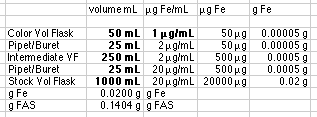
1. We have to use a 50 mL Final Flask. We are going to try a 1 µg/mL concentration. That means there must be 50 mL x 1 µg/mL = 50 µg of Fe in this flask. 2. Those 50 µg of Fe came in using a 10 mL pipet. That means the concentration in the pipet must be 50 µg/10 mL = 5.0 µg/mL. Since the pipet was taken from the Intermediate Flask, the concentration in the Intermediate Flask must also be 5.0 µg/mL. 3. Since the Intermediate Flask is 250 mL it must contain 5µg/mL x 250 mL = 1250 µg of Fe. These came in using a 25 mL pipet. This means the concentration in the pipet and in the Stock Solution must be 1250 µg/25 mL = 50 µg/mL. 4. The total Fe in the Stock Flask then must be 1000 mL x 50 µg/mL = 50,000 µg of Fe or 0.0500 g Fe. Converting this to grams of ferrous ammonium sulfate hexahydrate (FAS) shows we need to weigh out 0.3511 g of FAS. 5. We could do that. This would work. How did we know to use the pipets and volumetric flasks that were chosen? Pure dumb luck. We chose them because we had them and the pipet amounts would fit in the flasks. Had the final grams of FAS come out to some ridiculous value like 0.000345 g or 1523 g, we would have had to make some other choices. The nice thing about doing this on a spreadsheet is that we can change any of the volumetric ware we wish by just putting in a new number. The spreadsheet calculates the result. Here is an example:
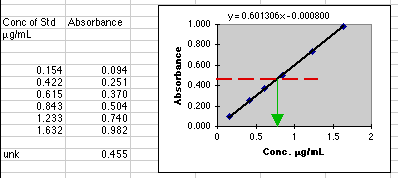
Rule 6: Do what needs to be done. You are probably busily writing down these numbers so you can go into the lab and make up your entire calibration curve. No such luck. You now need a plan to make the entire range of solutions for your Working Curve, such that you get absorbances from 0.100 to 1.000. This is a 10:1 range. Note that you would be unable to use a single Intermediate Stock to do this. If 5.0 mL were used to make 0.100 absorbance, then 50.0 mL would be needed to make 1.000 absorbance. 50.0 mL in the final 50 mL vol flask would not leave room for the color forming reagents. Solution: make two intermediate stock solutions: one for the low end of the range, the other for the high end. The details are left as an exercise for the student. [Hint: Take the spreadsheet above and turn it upside down. Fix the amount of FAS and the size of the Stock Volumetric Flask and the size of the Final Flask. Then put in values for the other volumes and let the spreadsheet compute the concentrations you will get in the Final Flask.] Remember too -- your scheme may not survive your first real run in the lab. Our guess that 1 µg/mL will give us 0.600 A may be way off base. If it is, remember Rule 1. Also remember that you probably will not need to change your Stock Solution. Just dilute it differently. A Final Note: If you are running a single unknown, you can optimize your working curve
to give the best possible value by choosing Working Curve concentrations
that are very close to your unknown concentration. This can only
be done after you have made a run using a Full Range working curve.
To make this work you need to be a class leader and get your first provisional
run done during the first period. This leaves time for fine tuning.
Don't be among those who follow this schedule: Period 1: Wait
for someone to figure this out. Period 2: Keep waiting.
Period 3: Quick make a run and take what you get. Turn in the
result and pray.
|
 Beer's
Law says that A=abC, but if we don't know the value of ab, we can't choose
a "C" to give us an "A" that our instrument can read. You may need
literature values for the absorptivity, a, or you may have sample working
curves from another instrument that tells you about what "A" to expect
given a "C." In this example your instructor has given you the information
that "around 1 µg/mL falls somewhere in the range." You assume
that this might give an absorbance of 0.6 and proceed, keeping Rule 1 in
mind.
